Lawtons’ team of specialist defence lawyers in London – bring you the below infographic, using data taken from the Metropolitan Police Force’s year-end crime statistics, press release here, (April ‘18) and the up-to-date Crime Data Dashboard.


London crime statistics: Police funding & resources
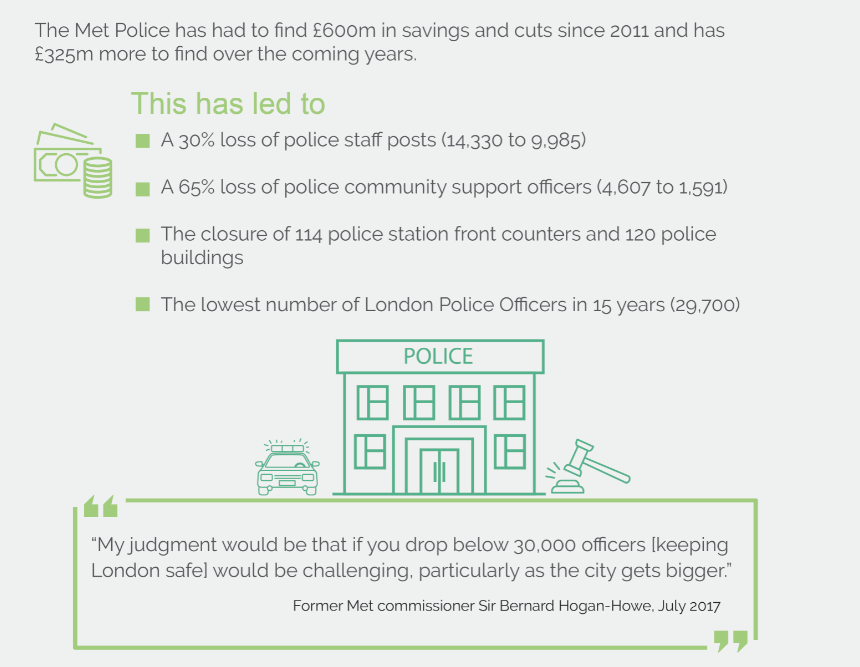
The Metropolitan Police Service has had to make £600m in savings since 2011, leading to drastic cuts in police presence on the streets of the capital and an increase in violent criminal offences in London.
Over the last 7 years, this substantial budget reduction has led to:
- A 30% decrease in overall police numbers, from 14,330 in 2011 to 9,985 in 2018
- A 65% reduction in the number of community support officers, from 4,607 to only 1,591
- The closure of 114 police station counters
The number of police officers currently policing the streets of London is currently at the lowest level it has been in the last 15 years, with only 29,700 officers currently active.
With an additional £325m of cost savings still required, these issues are only set to worsen.
Speaking in July 2017, former Metropolitan Police commissioner Sir Bernard Hogan-Howe predicted that:
‘….If you drop below 30,000 officers…(keeping London safe)…would be challenging, particularly as the city gets bigger’.
Unfortunately, Sir Hogan-Howe’s foresight is proving to be correct, with the criminal offences of ‘ Violent Crimes Against The Person’ increasing by 5.3% across London in the 12 months preceding May 2018 compared to the same timescale the previous year.
This criminal classification includes:
- Assault Causing Bodily Injury
- Common Assault
- Harassment
- Murder
- Use of an Offensive Weapon
- Wounding and Grievous Bodily Harm
London crime statistics: Types of offences
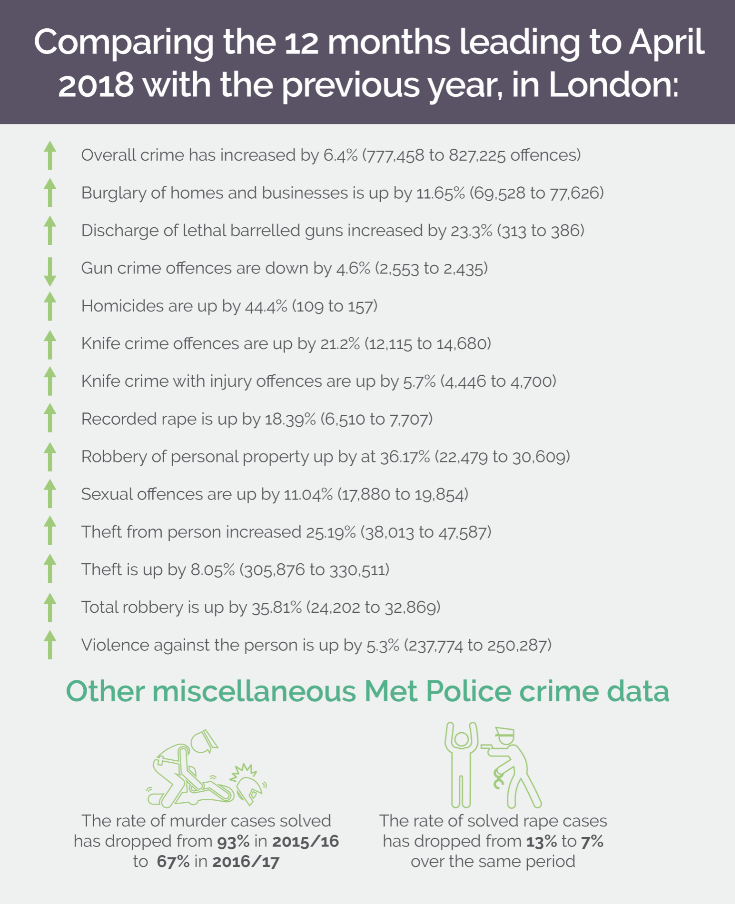
Metropolitan Police data shows that overall crime in London has increased by 6.4%, with knife crime offences increasing by 21.2% and knife crime with injury offences increasing by 5.7%.
Although overall gun crime has reduced by 4.6%, offences involving discharge of a lethal barrelled gun have increased by nearly 24%.
Assistant Commissioner Martin Hewitt states:
‘The Met continues to experience a very busy and challenging time against the backdrop of significant reductions in resources. I am very concerned about the rise in crime in the capital, particularly murder, violent crime and knife crime.’
Offences involving theft and robbery have also seen a considerable year on year increase, with cases of:
- Robbery increasing by 35.8%
- Theft from the person increasing by almost 26%
- Overall theft increasing by 8%
- Robbery of personal property has also increased by a considerable 36%
Solved murder cases dropped from 93% in 2015/16 to 67% in 2016/17, yet overall cases of homicide have increased by 44%.
Sexual offences have increased by 11%, with recorded rape offences up 18.3%. Cases of solved rape have decreased from 13% to 7%.
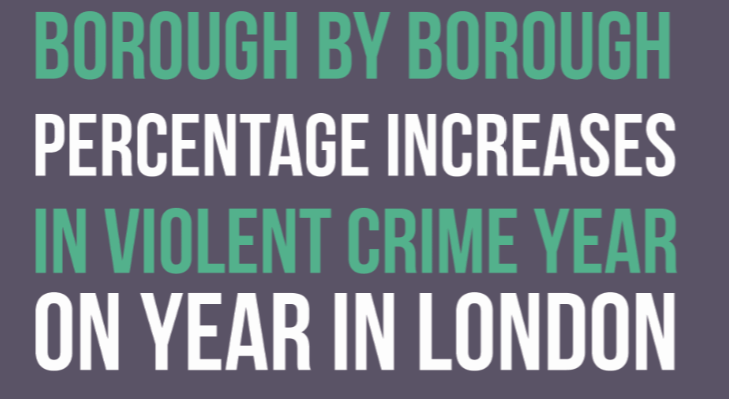
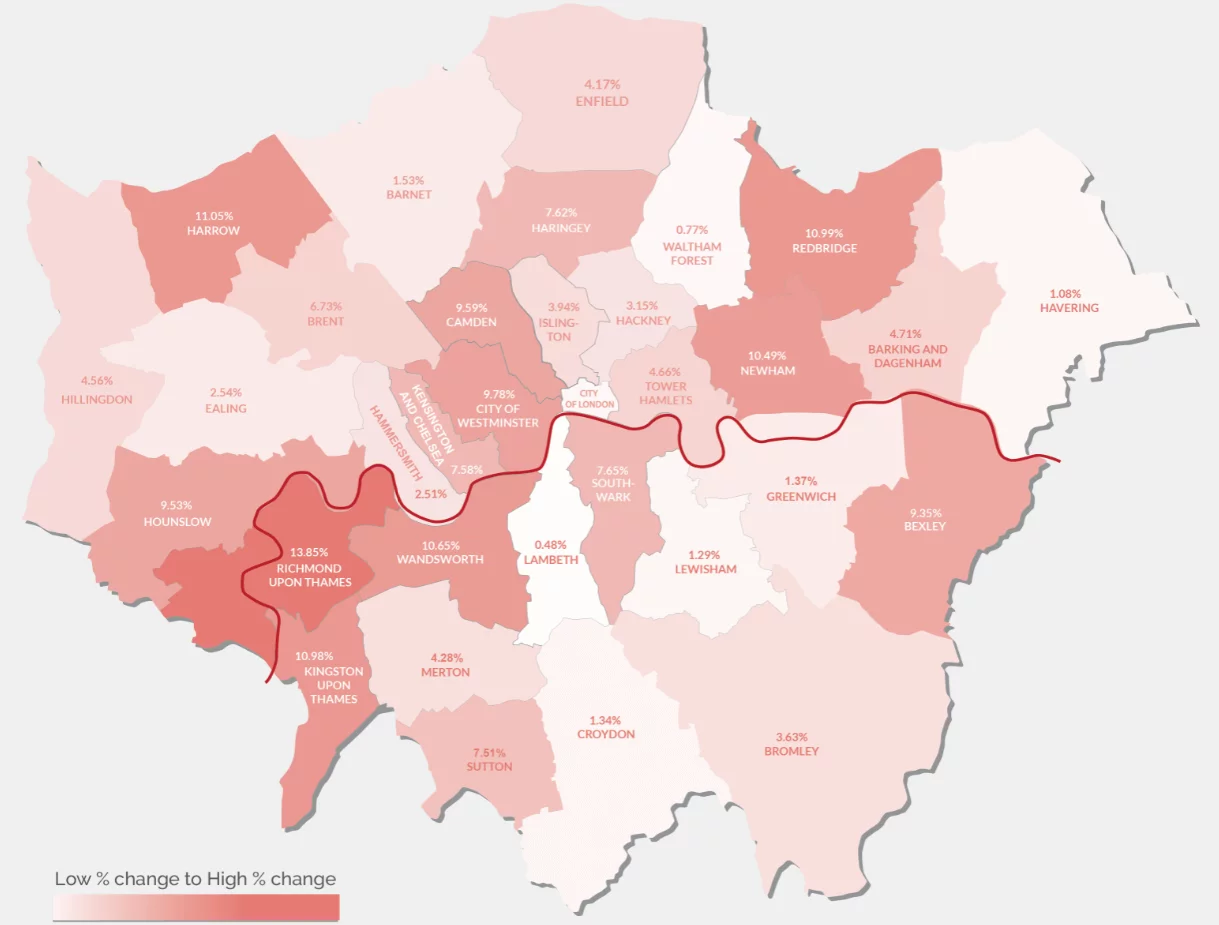
London crime statistics: The worst hit boroughs
With the police force stretched to capacity, recorded crime levels are increasing in areas of the capital and across greater London which have previously been perceived as ‘safe’, for example:
- Richmond Upon Thames has seen an increase in recorded crimes of nearly 11% year on year
- The borough of Kensington and Chelsea has seen a year on year increase of almost 8%
- Sutton has seen a 7.5% increase year on year
Conversely, areas which may be perceived to suffer from a higher rate of crime have remained relatively level, with:
- Tower Hamlets seeing an increase of 4.4%
- Merton seeing a 4.8% increase
- Croydon seeing a very minor growth in their existing crime rate, increasing by only 1.3%
Other Boroughs of note:
Newham Crime Rate
- Violence Against the Person crime in Newham has increased 10.49% year on year.
Sutton Crime Rate
- Sutton has seen a 7.51% increase in Violence Against the Person crimes in the 12 months leading to May 2018 versus the previous 12 months.
Croydon Crime Rate
- Violence Against the Person crime in Croydon has increased 1.34% year on year.
Lewisham Crime Rate
- Lewisham saw a year on year increase of 1.29% in Violence Against the Person crime – the third lowest increase of all boroughs
Hackney Crime Rate
- Hackney violent crime increased by 3.15% year on year.
Sources
https://www.met.police.uk/sd/stats-and-data/met/year-end-crime-statistics/
https://www.met.police.uk/sd/stats-and-data/met/crime-data-dashboard/
https://www.met.police.uk/sd/stats-and-data/met/year-end-crime-statistics/
https://www.london.gov.uk/press-releases/mayoral/stark-reality-of-government-police-funding-cuts